Portfolio Reset for Operating Partners: Standardized Metrics and Early Intervention Triggers
")
Many operating partners spend the year responding to portfolio problems that could have been spotted as early as January.
For example, a company might miss its Q1 pipeline targets, but the discussion only happens in April. Another might see win rates drop in February, but action isn’t taken until the forecast is in danger. Churn trends can show up in Q1, but often go unaddressed until renewals are already lost.
Operating partners can spot performance gaps early, but without standardized metrics and clear triggers for action, it’s hard to act quickly. By the time issues come up in board meetings, it’s often too late to fix them.
January is different. Schedules are less crowded, companies are setting their routines, and operating partners have time to put systems in place that help avoid surprises later.
The January Advantage: Fewer Meetings, Better Insights
From late December to early January, operating partners can pause the day-to-day firefighting and focus on designing systems for the whole portfolio. This is the time to ask key questions: Which metrics show GTM health? How can we compare performance fairly? What signs should trigger early intervention?
Operating partners who use January to set up these systems rely on data, not just intuition.
The Portfolio Dashboard: Four GTM Metrics That Matter Most
To oversee a portfolio well, you need a focused set of metrics that apply to all companies and highlight performance patterns early.
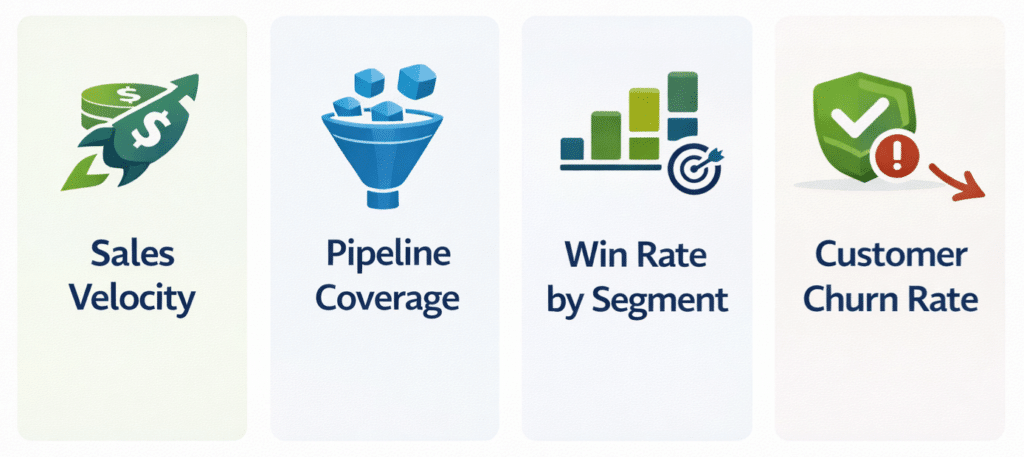
Sales velocity brings together deal size, win rate, cycle time, and rep productivity into one metric. You can track it monthly and compare it across all portfolio companies.
Pipeline coverage shows if your numbers support the plan. It should be based on real win rates, not just hopeful estimates.
Win rate by segment shows if companies are going after the right opportunities. If win rates drop, it usually means there’s a mismatch between the ideal customer profile and the real pipeline.
Customer churn rate shows if revenue is growing or slipping away. If net revenue retention falls below 90%, the business is losing customers faster than it can bring in new ones.
Operating partners who set these four metrics as a baseline in January can spot which companies need quick help, which are doing well, and where there are patterns to repeat.
Week 1: Segment Companies and Set Intervention Triggers
Operating partners sort portfolio companies into Green, Yellow, and Red groups based on their GTM performance.
Green companies show strong sales velocity, solid pipeline coverage, steady win rates, and stable retention. They only need light oversight, not hands-on help.
Yellow companies have one or two GTM issues holding back growth. They need targeted support for things like defining their ideal customer profile or fixing sales process gaps.
Red companies face several GTM problems that put the plan at risk. They need specialists to step in right away to steady execution.
In Week 1, set clear triggers for when to step in, so decisions are consistent. For example, if sales velocity drops by 15%, bring in specialists. If churn goes over 12%, focus on retention. If pipeline coverage falls below 3x, talk to the CEO right away.
Weeks 2 to 3: Scale Patterns and Deploy Specialists
In Week 2, look for repeatable patterns in Green companies. Operating partners watch what top performers do differently and write down practices that can help Yellow and Red companies, too.
Strong discipline around ideal customer profiles helps improve win rates. Clear criteria for moving deals forward speed up pipeline velocity. Getting customers to value quickly lowers early churn.
In Week 3, send GTM specialists to Red companies. These specialists address issues like misaligned customer profiles, pipeline qualification gaps, sales process breakdowns, or problems with retention systems.
Operating partners also look for high-value AI pilots that improve GTM efficiency, such as lead qualification or detecting churn risk.
Week 4: Lock Portfolio-Wide Cadence
Each month, portfolio GTM reviews use the same metrics to compare how companies are doing. Operating partners check sales velocity, pipeline health, win rates, and churn to spot where early help is needed.
Every quarter, GTM deep dives bring portfolio leaders together to share what’s working and help everyone learn faster.
Monthly CEO peer discussions help keep everyone accountable. When CEOs see how others have solved similar problems, they’re more likely to adopt new solutions quickly.
This regular schedule keeps things on track. Problems are found each month, specialists step in to help, and progress is tracked every quarter.

Why This System Works
Using the Green/Yellow/Red triage system, along with consistent metrics and clear triggers, makes it easier to oversee the whole portfolio. Operating partners can use data to decide where to put resources, instead of just reacting to the noisiest issues.
Companies get the right support at the right time. Green companies aren’t micromanaged. Yellow companies get focused help. Red companies get immediate attention. The whole portfolio moves faster because you spot patterns early and scale solutions.
Download the January Fast Start Guide for PE-backed GTM teams and use the weekly blueprint to standardize how you manage your portfolio and plan interventions.
In January, you can set up systems that make portfolio GTM performance clear and actionable. Otherwise, you risk spending the rest of the year finding problems too late to fix them well.