How CEOs and CROs Turn Revenue Targets into Sales Velocity Math
")
Many revenue plans fall apart within the first month.
It’s not that the targets are off or teams aren’t motivated. The real problem is that targets don’t get broken down into the pipeline numbers needed to hit them. CEOs set big growth goals, CROs agree, and both hope hard work will bridge the gap between goals and results.
By March, last year’s challenges are still there. Win rates stay the same. Cycle times haven’t gotten shorter. Pipeline coverage relies on hope instead of real conversion data. The plan might look solid on paper, but the way bookings happen hasn’t changed.
In January, PE-backed CEOs and CROs either set up the numbers that make growth predictable or put it off until issues are hard to ignore.
Why January Is the Critical Planning Period
PE timelines move fast. With only 18 to 24 months, every quarter has to add value instead of making up for mistakes. There’s no time for a slow start and a late push.
January gives you a rare chance to review performance, spot bottlenecks, and set up execution systems before quota pressure leads to rushed decisions. This window closes quickly. By February, routines are set, sales teams have their habits, and forecasts are built on shaky assumptions.
Top PE-backed companies use January to build their revenue plans. Those that take it easy early on end up dealing with problems for the rest of the year.
The Three Numbers Your Board Trusts Most
Operating partners and boards look at revenue performance in three main ways to see if growth will last or if it’s shaky.
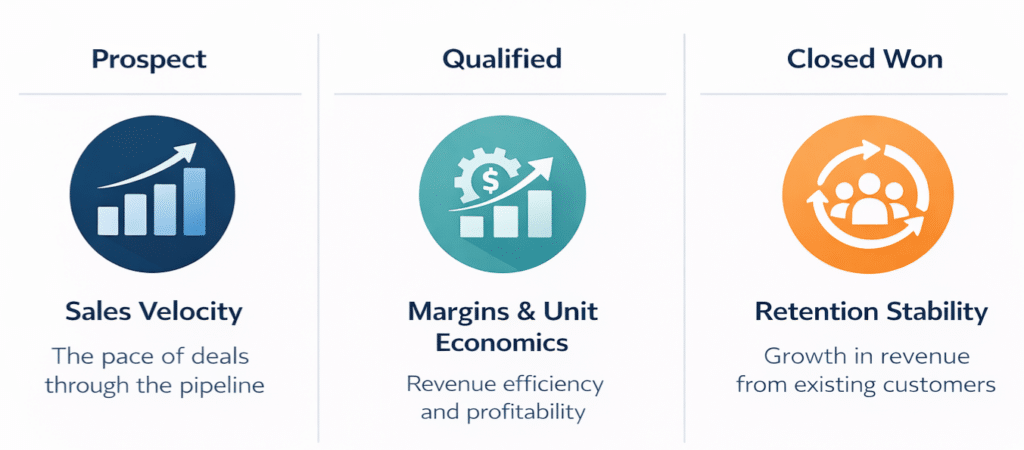
Sales velocity measures how quickly deals move through the pipeline and how efficiently you generate revenue. It combines deal size, win rate, cycle time, and rep capacity into one number. Boosting velocity by 15 to 25% often brings more growth than hiring more people.
Margins and unit economics show if your revenue is actually valuable or just busy work. Strong margins mean you have pricing power and run efficiently. Weak margins show growth is costly and might not last through an exit.
Retention stability shows if your revenue is growing or slipping away. Net revenue retention over 100% means your current customers are buying more. Below 90% means you’re losing customers faster than you’re gaining them.
CEOs and CROs who measure these three metrics in January can clearly see what’s working, what’s holding growth back, and where to focus for the biggest impact.
Weeks 1 to 2: Baseline Performance and Identify Constraints
Week 1: Set your sales velocity baseline using last year’s actual numbers. CEOs and CROs should figure out average deal size, win rate by segment, cycle time, and rep productivity with real data, not guesses. This gives growth discussions a solid foundation.
This process often uncovers tough realities. Pipeline coverage might rely on win rates the team hasn’t hit in years. Cycle times could be getting longer, not shorter. A few top reps may be hitting quota while others fall short.
In Week 1, CEOs should pinpoint the one or two biggest things holding back growth. Is it not enough pipeline? Low win rates in a certain segment? Not enough sales capacity? If you don’t know the main problem, adding more resources or motivation just means more activity, not better results.
Week 2: Align the executive team on your ideal customer, pipeline definitions, and growth assumptions. Revenue plans fall apart when Marketing, Sales, and Customer Success use different definitions for qualified leads, winnable deals, and accounts ready to grow.
CROs should turn the annual target into quarterly pipeline goals using the win rates and cycle times from Week 1. If the numbers don’t add up, adjust the plan before making promises to the board.
CEOs should pick no more than three Q1 priorities and assign clear executive ownership. Making changes in order builds momentum and lets teams see progress before tackling the next challenge.
Weeks 3 to 4: Refine Forecasts and Lock the Board Narrative
Week 3: Make stage exit criteria stricter and check the pipeline against your ideal customer profile. CROs should go through the pipeline with sales managers to spot deals that shouldn’t be in the forecast. Only let deals move forward when they meet clear qualification steps. This keeps coverage realistic and makes forecasts more accurate.
CEOs should assign executive sponsors to their biggest revenue accounts to protect retention and drive growth. Reaching out to customers early in Q1 helps spot risks before they turn into churn.
Week 4: Create a forecast for the board that clearly separates pipeline risk from execution risk. Most forecasts hide risk in big numbers. A good forecast shows where coverage is weak, which segments are working, and what actions will close the gaps.
CROs should show how making the team more efficient can drive growth without needing to hire right away. Boards prefer plans that focus on better win rates and faster cycles, not just adding more reps.
CEOs refine the board narrative to explain what changed from last year, what’s being fixed, and why the plan is achievable. The narrative connects sales velocity improvements to valuation drivers and shows where investments create leverage.

Why This Approach Works
Starting January with a math-first approach closes the gap between targets and execution. When CEOs and CROs measure sales velocity, find bottlenecks, and turn goals into pipeline numbers, growth becomes something you can count on—not just hope for.
Companies that set this discipline in January see real improvements by the end of Q1. Win rates go up because the pipeline is checked against the ideal customer profile. Cycle times get shorter because stage rules are enforced. Forecasts get more accurate because deals are reviewed closely.
Download the January Fast Start Guide for PE-backed GTM teams and use the CEO and CRO week-by-week plan to set your Q1 execution pace.
In January, you either turn your targets into clear numbers or spend your board meetings explaining what went wrong.


